

The safest & most dangerous cities in the UK
Crime in the UK is changing. While some traditionally higher-visibility offences have declined in many areas, newer challenges are emerging. Understanding where – and why – crime happens helps residents make informed decisions about safety and prevention.
Using the latest 2026 data from the Office for National Statistics (ONS), Police.uk, CrimeRate.co.uk and the Scottish Government, this article provides a data-led overview of crime rates across UK cities. We highlight which areas record the highest and lowest levels of crime, explore the social and regional factors behind these trends, and offer practical steps for protecting your home.
The aim is simple: to inform, not alarm – giving you the facts you need to feel safe, wherever you live.
This article uses crime data from England, Wales and Scotland, reflecting the most recent and comprehensive government studies available at the time of writing – notably the Crime Survey for England and Wales (CSEW) and police-recorded crime statistics. While the title refers to the “UK”, this reflects how these datasets are commonly discussed in national reporting; the underlying figures are drawn from England, Wales and Scotland due to the availability and consistency of official sources.
How Crime Is Measured
Two of the primary sources for UK crime data are the Crime Survey for England and Wales and police-recorded crime statistics. The CSEW asks individuals aged 16 and over about their experiences of crime in the past 12 months, capturing crimes not reported to police as well as those that are. Police-recorded data, maintained by the Home Office and ONS, tracks offences formally logged by police forces – useful for spotting trends, but influenced by changes in reporting and recording practices. The ONS itself notes that police recorded crime “is not always a good indicator of general trends in crime” on its own.
The national figures below come from the ONS bulletin Crime in England and Wales: year ending June 2026, published on 22 October 2026. City rankings use CrimeRate.co.uk’s 2026 figures, which are based on Police.uk data for the 12 months ending April 2026.
Key National Trends
Estimated incidents of CSEW “headline crime” (theft, robbery, criminal damage, fraud, computer misuse and violence) in the year ending June 2026 – no statistically significant change on the previous year’s 9.3 million (ONS).
Police-recorded homicides fell 1% (from 519), while firearms offences fell 8% to 5,065 and knife-enabled crime fell 6% to 48,615 (ONS, year ending June 2026).
Police recorded 222,304 burglary offences (residential and non-residential) in the year ending June 2026 – down 6% year-on-year (ONS).
Fraud rose to an estimated 4.5 million incidents and computer misuse rose 23% to 817,000. The ONS says crime against individuals and households has generally fallen over the last 10 years, “with some notable exceptions, such as fraud.”

For residents of UK cities – and the wider country – the data highlights several practical takeaways for staying physically secure at home.
- Crime levels vary sharply by neighbourhood, so checking local police or ward-level data gives a more accurate picture of your area’s risks.
- Burglary and vehicle-related theft remain highly location-dependent, making strong locks, good lighting and visible alarms especially valuable in higher-risk zones.
- Your immediate environment influences risk – high-density housing, busy nightlife areas or poorly lit streets often see more opportunistic crime, so tailoring your security to your surroundings is key.
- Community awareness is a major protective factor – Neighbourhood Watch groups, proactive neighbours and clear communication help deter offenders and reduce repeat incidents.
- Layered home protection works best – combining locks, exterior lighting and CCTV creates multiple barriers that discourage break-ins.

Here, we examine which major cities currently record the highest crime rates. Cities are ranked by overall recorded crime per 1,000 people for the 12 months ending April 2026, as published by CrimeRate.co.uk using Police.uk data. For context, the overall rate across England, Wales and Northern Ireland on the same measure is roughly 72 crimes per 1,000 people.
Interpreting the Term “Most Dangerous”
A high crime-rate city does not mean every neighbourhood is unsafe – within each city there are major variations between wards, neighbourhoods and even times of day. Even in higher-rate cities, the majority of homes will not experience serious crime. The emphasis should be on targeted vigilance, prevention and layered security, rather than fear.
Major UK Cities With the Highest Crime Rates in 2026
Overall recorded crimes per 1,000 people, 12 months ending April 2026. Source: CrimeRate.co.uk (Police.uk data).
| Rank | City | Crime Rate | Crime Profile |
|---|---|---|---|
| 1 | Middlesbrough North East England | 145 per 1,000 | About double the national rate. Violence and sexual offences are the most common crimes (9,022 offences), and the robbery rate is just over three times the national average. |
| 2 | Blackpool Lancashire | 129 per 1,000 | 80% above the national rate. Violence and sexual offences are the most common crimes, with 10,974 offences recorded. |
| 3 | Bradford West Yorkshire | 122 per 1,000 | Drug offences and vehicle crime both run at almost twice the national average; 22,095 violence and sexual offences were recorded. |
| 4 | Kingston upon Hull East Yorkshire | 115 per 1,000 | Public order offences run at about twice the national average; 15,333 violence and sexual offences were recorded. |
| 5 | Nottingham Nottinghamshire | 108 per 1,000 | 50% above the national rate, with robbery running at more than twice the national average (1,044 offences). |
| 6 | Leeds West Yorkshire | 107 per 1,000 | 49% above the national rate. Burglary runs at about twice the national average and robbery is 1.85 times higher. |
| 7 | Liverpool Merseyside | 106 per 1,000 | 25% above the Merseyside average, with public order offences (6,692 reports) running at almost twice the national rate. |
| 8 | Southampton Hampshire | 106 per 1,000 | 69% above the Hampshire average. Weapon-possession offences run at 2.4 times the national average and shoplifting at 1.9 times. |
| 9 | Birmingham West Midlands | 105 per 1,000 | The most dangerous major city in the West Midlands; in April 2026, vehicle crime and robbery both ran at more than twice the national average. |
| 10 | Bristol South West England | 105 per 1,000 | Public order offences (6,986 reports) run at about twice the national average, and burglary is trending upwards. |
Why doesn’t London appear in the top 10? London has the highest total number of crimes – simply because it’s by far the largest city and population centre in the UK. When adjusted per capita, though, London’s crime rate per 1,000 people is lower than in several smaller urban areas. According to CrimeRate.co.uk, London’s overall crime rate for the 12 months to April 2026 was 82 crimes per 1,000 people, compared with 145 in Middlesbrough and 129 in Blackpool.
Are Crime Rates in the UK Rising or Falling?
Nationally, the Crime Survey for England and Wales estimated 9.7 million incidents of headline crime (theft, robbery, criminal damage, fraud, computer misuse and violence) in the year ending June 2026 – no statistically significant change on the previous year. Several police-recorded offences are improving: homicides fell 1%, knife-enabled crime fell 6%, burglary fell 6%, vehicle offences fell 7% and theft from the person fell 20%. Concern remains in other areas, however – fraud rose 11% and computer misuse rose 23%. In Scotland, police recorded 315,357 crimes in 2025-26, a 5% increase on the previous year. Because city-level trends often differ from national averages, it’s worth checking local force-area data for the most accurate picture.
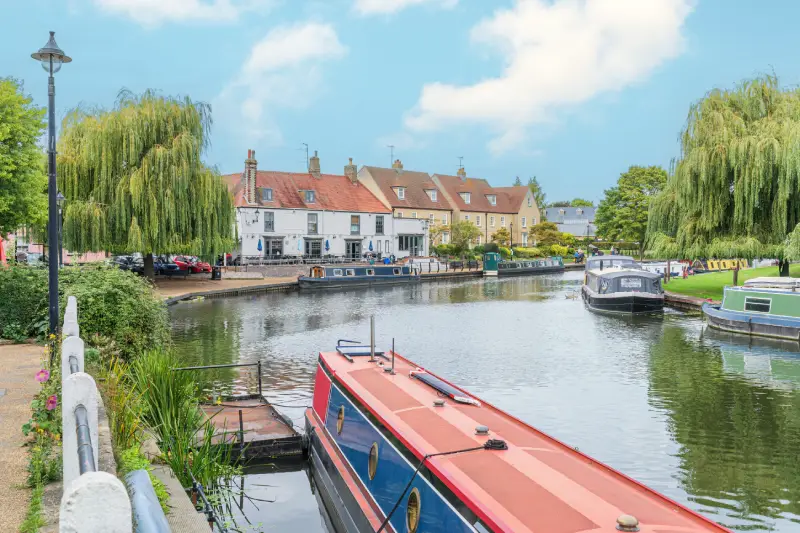
In contrast, below is a ranked list of ten cities, towns and London boroughs with crime rates below the national average, based on the same CrimeRate.co.uk measure (overall recorded crimes per 1,000 people, 12 months ending April 2026).
Interpreting the Term “Safest”
Even the safest cities contain neighbourhoods with varying risk levels – “safe” is a comparative term, not an absolute one. Low overall crime doesn’t eliminate the need for vigilance, as opportunistic crime can occur anywhere. For residents of safer cities, maintaining proactive home-security measures (alarms, smart locks, CCTV) sustains these positive trends.
Safest UK Cities and Urban Areas in 2026
Overall recorded crimes per 1,000 people, 12 months ending April 2026. Source: CrimeRate.co.uk (Police.uk data).
| Rank | City / Area | Crime Rate | Why It Features Among the Safest |
|---|---|---|---|
| 1 | Ely Cambridgeshire | 52 per 1,000 | The lowest rate in our ranking – 17% below the Cambridgeshire average, with very few robberies (2 offences recorded in 2026). |
| 2 | Richmond upon Thames London Borough | 54 per 1,000 | Ranked by CrimeRate as the third safest borough in London. |
| 3 | Harrow London Borough | 59 per 1,000 | 26% below the London rate and 18% below the national figure; among London’s ten safest boroughs. |
| 4 | Sutton London Borough | 59 per 1,000 | Among London’s five safest boroughs, with a crime rate 29% below the London rate of 82 per 1,000. |
| 5 | Bexley London Borough | 60 per 1,000 | Among London’s five safest boroughs, with a crime rate 25% below the London average. |
| 6 | Kingston upon Thames London Borough | 61 per 1,000 | 23% below the London rate and 15% below the national figure. |
| 7 | Lichfield Staffordshire | 63 per 1,000 | 13% below the national figure and 17% below the West Midlands average. |
| 8 | Swindon Wiltshire | 64 per 1,000 | 12% below the national figure, with violence and sexual offences close to the national average. |
| 9 | Winchester Hampshire | 67 per 1,000 | 7% below the national figure, with burglary trending downwards. |
| 10 | St Albans Hertfordshire | 68 per 1,000 | Ranked by CrimeRate as the safest major town in Hertfordshire. |
What about York, Bath, Cambridge and Edinburgh? These are often described as safe cities, but the 2026 figures don’t support placing them in a safest list. On CrimeRate’s measure, York (79 per 1,000), Cambridge (75), Exeter (77) and Bath all record crime rates slightly above the national figure. In Scotland, the Scottish Government’s Recorded Crime in Scotland 2025-26 shows Dundee City with the highest rate of any local authority (929 crimes per 10,000 people), with the City of Edinburgh among the highest too, against a national rate of 569 per 10,000. Scottish figures use different recording rules, so they aren’t directly comparable with those for England and Wales.
What Makes These Cities Safer?
Population & Environment
- Smaller populations and lower density. Cities and boroughs with fewer residents or less nightlife congestion tend to experience fewer violent and opportunistic crimes.
- Stable socio-economic conditions. Areas with lower deprivation levels and higher employment rates typically record fewer property crimes.
- Thoughtful urban design. Good lighting, visible CCTV coverage and secure housing infrastructure help reduce antisocial behaviour and burglary risk.
Policing & Community
- Active community policing. Close collaboration between local police forces and residents supports early intervention and deterrence.
- Engaged communities. Neighbourhood Watch programmes, local safety initiatives and civic pride play tangible roles in preventing crime.
- Lower repeat offending. Local focus on rehabilitation and prevention of reoffending correlates with safer urban environments.
When choosing where to live, reviewing local ward-level or neighbourhood data via ONS or Police.uk can help you form the most accurate personal safety picture.
Crime in the UK isn’t evenly distributed; it’s shaped by a mix of social, economic and environmental factors. Understanding these helps explain why some cities record higher crime rates, while others remain comparatively safe.
Socio-Economic Influences
- Areas with higher unemployment or deprivation often experience more acquisitive crimes, such as theft and burglary.
- Areas with stronger local economies and lower deprivation – such as St Albans or Winchester – tend to record lower rates.
- Access to services, youth engagement programmes and community investment can all help reduce long-term offending.
Urban Structure & Density
- Densely populated areas and busy nightlife districts see more violent and opportunistic offences, simply due to higher activity levels.
- Well-designed urban spaces with good lighting, visible security and active neighbourhood-watch schemes experience fewer crimes.
- Rural areas, though generally safer, can face different issues – such as vehicle or farm-equipment theft and slower police response times.
Demographics & Local Policing
- Cities with younger, more transient populations (students, renters, tourists) often show higher crime rates, particularly theft and antisocial behaviour.
- Stable, community-focused areas with strong local policing tend to fare better.
- Visible, trusted and proactive neighbourhood policing is linked to lower victimisation and higher confidence in reporting.
Seasonal & Regional Patterns
- Summer months often see increases in antisocial behaviour and public violence.
- Winter months bring more burglaries, as darker evenings offer greater cover.
- Urban areas generally record higher overall rates, but rural communities aren’t immune – their crimes just differ in type and frequency.
In short, UK crime rates are shaped by a complex mix of economic conditions, urban design, demographics and policing quality. While large, dense cities experience more recorded crime, community engagement, good design and targeted prevention make a measurable difference.
According to ONS data, police recorded 88,282 robbery offences in the year ending June 2026 – a 10% increase on the previous year. The picture is split: robbery of personal property fell 7% to 57,193 offences, while robbery of business property rose 67% to 31,089. The ONS links part of this rise to an April 2025 clarification of the rules for recording business robbery, but it still points to greater risk for commercial premises. Burglary, meanwhile, continues to fall, with 222,304 offences recorded – down 6% year-on-year.
Robbery offences recorded in the year ending June 2026 – up 10% year-on-year, while personal robbery fell 7%.
Rise in robbery of business property, to 31,089 offences – partly linked to an April 2025 change in recording guidance.
Estimated CSEW theft incidents in the year ending June 2026 – no statistically significant change on the previous year’s 2.8 million.
Police recorded 312,231 vehicle offences, down 7%, while theft from the person fell 20% to 115,891 offences.
Effective prevention of burglary and robbery isn’t about a single change, but about layering protective measures. Here are the key strategies that research and crime-prevention experts identify as helping you reduce risk and keep your home safe.
No matter where you live – from a busy city centre to a quiet rural street – home security starts with small, consistent actions. While overall crime in the UK is relatively stable, opportunistic offences like burglary and theft remain a concern. The good news is that a few practical measures can dramatically reduce your risk and increase peace of mind.
1. Check Locks and Entry Points Regularly
It may sound simple, but routine checks make a big difference. Ensure all doors and windows have modern, insurance-approved locks (such as BS3621). Don’t forget less-used access points – garages, sheds and side gates are common weak spots. If you’ve moved recently, consider replacing or rekeying locks to eliminate old key copies, and never leave your keys in the lock overnight.
Regular maintenance also deters opportunists; visible, well-kept security hardware sends a clear message that your property is protected.
2. Light Up Your Exterior
Good lighting is one of the most effective and affordable deterrents. Install motion-activated lights near driveways, porches and back gardens, and use smart lighting timers or app-controlled bulbs to make the home look occupied when you’re away. Keep pathways and entrances visible, as darkness and concealment provide opportunity.
According to police guidance, well-lit properties are significantly less likely to be targeted for burglary.
3. Secure Your Perimeter and Valuables
Lock away bikes, tools and outdoor equipment when not in use. Fit high fences or trellises with sturdy, ideally lockable, gates. Store valuables away from windows, and avoid leaving keys or wallets in plain sight near doors.
Small adjustments like these create multiple layers of security, increasing the effort required for entry and reducing appeal to opportunistic criminals.
4. Stay Connected With Your Community
A secure neighbourhood is a shared effort. Join or start a Neighbourhood Watch or local alert group – many UK communities now use WhatsApp or Nextdoor to share real-time safety updates. Report suspicious activity promptly, as local awareness remains one of the best forms of early prevention. If you live in a flat or shared building, encourage mutual vigilance and ensure communal entry points stay locked.
5. Invest in Smart Home Security Technology
Modern technology has made professional-level protection accessible to every household. Smart alarm systems, motion sensors and video doorbells offer instant alerts and remote monitoring from your phone. Professionally monitored systems go a step further, ensuring help is dispatched even when you’re away.
Verisure’s technology provides a trusted solution for modern home protection, combining 24/7 professional monitoring with smart sensors, remote video verification and rapid response links to emergency services. Whether you live in a high-crime city or a quiet town, Verisure’s systems are designed to detect, verify and respond to threats within seconds – giving you real peace of mind, wherever you are.
Layered Protection Builds Lasting Safety
Improving home security isn’t about a single product or measure; it’s about layers of protection – physical barriers, community awareness, and smart monitoring and technology. Together, these form a complete defence that deters intruders and reassures residents, wherever you live.
- Verisure RapidResponse™ – threats assessed and acted on within seconds
- Advanced technology combined with highly trained security experts
- A free, no-obligation quote on a smart home security system
Frequently Asked Questions
Of the major cities in our 2026 ranking, Middlesbrough has the highest crime rate, at 145 crimes per 1,000 people, followed by Blackpool (129) and Bradford (122). These figures are from CrimeRate.co.uk for the 12 months ending April 2026; exact rates vary by source and over time.
In our 2026 ranking, Ely in Cambridgeshire has the lowest crime rate, at 52 crimes per 1,000 people, followed by the London Borough of Richmond upon Thames (54) and Harrow (59). Smaller population size, active community policing and stable socio-economic conditions are common factors behind lower crime rates.
London records the highest total number of crimes simply because it’s the UK’s largest city by population. Adjusted per capita, its crime rate – 82 crimes per 1,000 people in the 12 months to April 2026 – is lower than in several smaller cities, such as Middlesbrough (145 per 1,000).
The picture is mixed. The ONS estimated 9.7 million headline crime incidents in the year ending June 2026, with no statistically significant change on the previous year. Police-recorded burglary fell 6%, vehicle offences fell 7% and homicides fell 1%, but fraud rose 11% and computer misuse rose 23%, so trends vary by offence type and by local area.
Fit insurance-approved locks, add motion-activated exterior lighting, secure sheds and side gates, and stay connected with neighbours through a Neighbourhood Watch or local group. A monitored alarm system with CCTV adds a further, professionally-backed layer of protection.
Sources: Office for National Statistics (ONS), Crime in England and Wales: year ending June 2026 (published 22 October 2026); Police-Recorded Crime by Force Area; Crime Survey for England and Wales; Police.UK; CrimeRate.co.uk (city and borough rates, 12 months ending April 2026); Scottish Government, Recorded Crime in Scotland, 2025-26. Figures refer to the reporting periods stated.